Interviewees came from 131 universities and 48 different states, while the 2023 entering class came from 33 states, representing 57 different universities. To find out more about some of our students, check out our Students Liaison page.
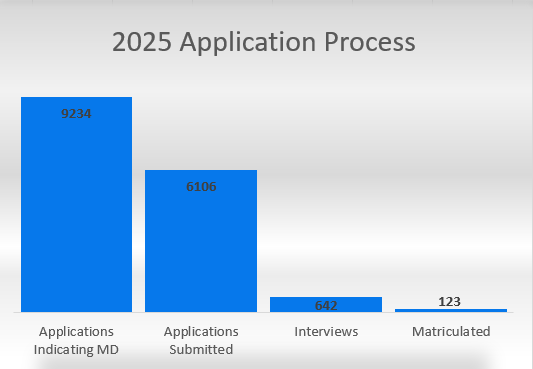
Number of Applicants
Gender Representation of Applicants

URM Representation of Applicants

MCAT & GPA Distribution of Applicants

Outer lines/tails and dots indicate max & min scores of group, colored boxes (light blue, dark blue, grey) indicate middle 50% of scores, and line through colored box indicates median score of group.