The 2025 entering class is from nine universities:
- Carnegie Mellon University
- Columbia University in the City of New York
- Duke University
- Johns Hopkins University
- Luther College
- Massachusetts Institute of Technology
- Stanford University
- University of Texas at El Paso
- Virginia Commonwealth University
To find out more about our current students, visit our MSTP Student Directory outreach page.
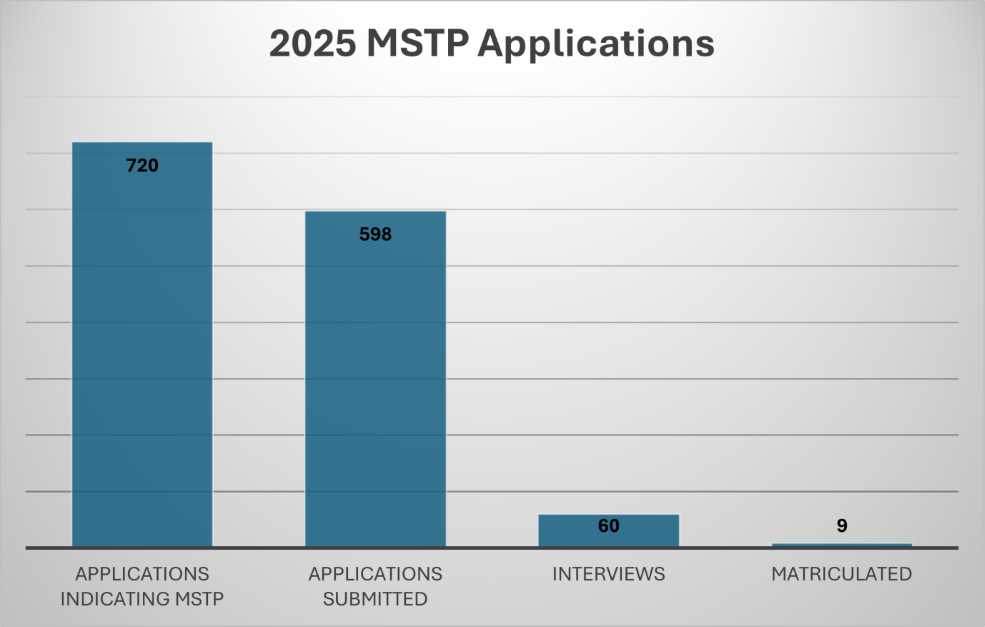
| Average Number of Applications Submitted | 530 |
| Average Number of Interviews Conducted | 63 |
| Average Number of Matriculated Students | 8 |
| Year | 1st Year MD Matriculants | 1st Year PhD Matriculants | Average GPA | Average MCAT |
|---|---|---|---|---|
| 2025 | 9 | 0 | 3.9 (3.72-4.0) | 520 (515-526) |
| 2024 | 8 | 1 | 3.9 (3.83-4.0) | 520 (511-526) |
| 2023 | 8 | 0 | 3.9 (3.81-4.0) | 515 (500-521) |
| 2022 | 7 | 0 | 3.8 (3.22-3.99) | 519 (510-526) |
| 2021 | 9 | 0 | 3.8 (3.73-3.97) | 517 (509-524) |
| 2020 | 8 | 0 | 3.8 (3.65-4.0) | 519 (511-523) |
| 2019 | 10 | 3 | 3.8 (3.60-4.0) | 520 (513-525) |
| 2018 | 12 | 0 | 3.8 (3.55-3.98) | 517 (503-525) |
| 2017 | 9 | 1 | 3.8 (3.50-4.0) | 37.0/517 (37)/(517-524) |
| 2016 | 12 | 0 | 3.8 (3.49-4.0) | 37.0/512 (33-41)/(508-521) |