Proteomics
We offer sample processing and cleanup procedures as part of our routine service. This includes removal of salts, buffers, and detergents not otherwise compatible with downstream mass spectrometry analysis. Should you desire to perform some of these protocols yourself, please see our sample preparation protocols and/or contact our Facility for the best procedure for your sample. Sample cleanup, enrichment, and processing services include;
- Tissue or Cell lysis and protein solubilization
- Sample Cleanup with C18 Zip Tip or MW cutoff Filter (Amicon 6, 10, 20 KDa)
- Sub-proteome fractionation based on:
- Phosphorylation (IMAC or TiO2 enrichment)
- Acetylation or Ubiquitination (Cell Signaling Technology Antibody)
- Protein denaturation (various strategies including detergents such as SDS and chaotropoes such as Urea)
- Reduction, alkylation, and trypsin digestion (free solution or in-gel) using STrap (Protifi), SP3 or deoxycholate based strategies
Molecular Weight Determination
Molecular weight determination for a purified protein or peptide can often be performed via LC/ESI/MS using a fast ("ballistic") reversed-phase gradient and a high resolution mass spectrometer. Generally, we recommend the direct infusion of purified protein solutions following buffer exchange into an ammonium bicarbonate buffer system to remove non-volatile salts. The success of these experiments using ESI is often dependent on molecular weight (<50 kDa performs best) as well as complexity of the starting sample.
Protein Identification Based on Tandem Mass Spectrometry
Protein identifications are made based on automated database searches of tandem mass spectra of peptides.
We use high resolution (R>100,000) tandem mass spectrometers to provide accurate mass measurements of both peptide molecular weight (MS data) and peptide fragments (MS/MS). High-end mass spectrometers yield high quality data and highly confident identification.
Qualitative identifications from gel bands or more complex samples, such as cell lysates, are performed using higher-capacity separations (30 min to 2 hours) coupled to Orbitrap mass spectrometers using either Data Dependent Acquistion (DDA) or Data Independent Acquisition (DIA) approaches. Higher capacity separation allows for analysis of more complex samples and more confident identification of larger numbers of proteins. DDA is searched using Sequest and DIA data is searched using Spectonaut (Biognosis) in a false-discovery controlled workflow.
Database Search Engines
We use two principal search engines: Sequest (ThermoFisher) and Spectonaut (Biognosis). Sequest identifies based on serial MS/MS datasets (data dependent acquisition), whereas Spectonaut identifies based on multiplexed MS/MS datasets (Data Independent acquisition windows).
1. Spectonaut
Currently Available Databases
These databases are available via sequest or spectonaut. If your organism of interest is not included here, please check the corresponding websites, or contact the proteomics facility to see if a FASTA format database is available. If so, your favorite organism's database can be added to our search engines for a small one-time setup fee.
1. Swissprot
Mounted Swissprot databases include human, mouse, xenopus and E. coli. Other SP databases will require a nominal one-time setup fee.
2. Trembl
Other database resources not currently included, but that can be made available can be found at the National Center for Biotechnology Information (NCBI).
We offer relative protein quantitation based on several paradigms; including label-free quantitation (MS1 or MS2), chemical isotope labeling expression analysis (Tandem Mass Tagging), metabolic labeling (SILAC) and targeted protein expression using isotope labeled internal peptide standards.
Open, unbiased ('omic) differential protein expression can be performed using label-free technology with DDA or DIA processing on any of our nanoUPLC systems coupled to Orbitrap mass spectrometers. We recommend triplicate analysis of each biological replicate to increase statistical significance of the peptide (and thus protein) fold-changes measured. These experiments can extend to studies including protein expression as a function of time given an external stimuli or gene knockout, for instance. Label-free differential expression is only available on separations utilizing a single dimension of liquid chromatography (LC) prior to tandem mass spectrometry (MS/MS).
Open, unbiased ('omic) differential protein expression can also be performed using chemical isotope labeling technology for parallel processing of up to eightteen samples (TMTPro 18-plex) within a single LC-MS/MS or LC/LC-MS/MS experiment. Data dependent acquisition on an Orbitrap mass spectrometer and Sequest database searching is used with isotope-labeling experiments. Differential expression utilizing isotope labeling can be performed with either single dimension (LC-MS/MS) or multidimensional (LC/LC-MS/MS) separations.
For targeted protein expression experiments, a triple quadrupole mass spectrometer operating in a multiple-reaction-monitoring (MRM) mode is used to detect very specific signals from the target peptides of interest. This technique is approximately one order of magnitude more sensitive than the open ('omic) approach and provides improved quantitative precision. However, only targeted peptides are quantified. MRM mass spectrometry is the best way to verify fold-change data obtained from open ('omic) differential expression studies on the Oribtraps.
Proteomics provides qualitative and quantitative information on the direct products of gene expression - proteins. Differential expression proteomics characterizes changes in the proteome due to biological challenges such as genotype, disease state and drug treatment. Additional applications include characterization of protein:protein interactions and biomarker identification.
- Full support: Experimental design, sample preparation, sample analysis and initial data analysis
- State-of-the-art LC/MS/MS based technology using rigorous quality control metrics
- Technology applicable to cell lines, tissues and biofluids
- Cell lines and tissues yield coverage for several thousand proteins without fractionation
HeLa Samples: 230,000+ Peptides AND 8,500+ Proteins from 30min DIA Analysis on Orbitrap Astral
Principal Component Analysis
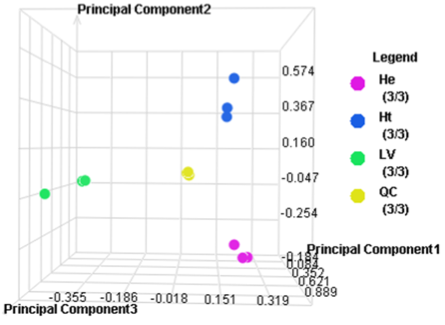
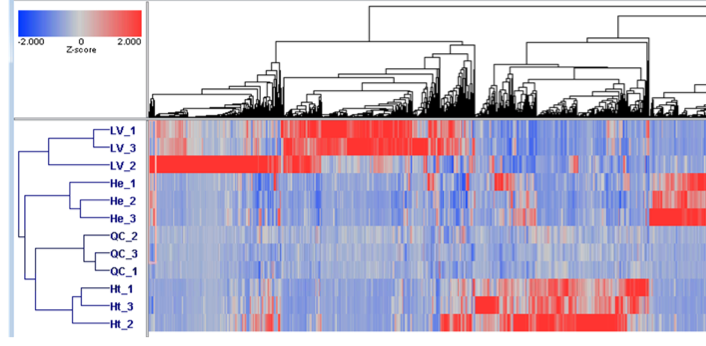
Expression results Z-score normalized with 2D Agglomerative Cluster Analysis
Workflow
- Sample Preparation
- LC/MS/MS
- Data Workup
Quantitative proteomics of biofluids can be an important discovery tool for characterizing disease and response to therapy and identifying biomarker candidates. Methods are amendable to animal models and human samples. Up to 7,000 proteins can be quantitativley characterized from plasma using the SEER Proteograph platform coupled to Orbitrap Astral downsteam detection.
- Full support - experimental design, sample preparation and data collection, initial data analysis
- State-of-the-art LC/MS/MS based technology using rigorous quality control metrics
- Expertise with plasma, CSF, nasal and bronchoalveolar lavage, synovial fluid
SEER Proteograph Product Suite allows for characterization of up to 10X more protein groups than direct (neat) methods. With the Proteograph Product Suite, Seer enables you to uncover the insights that will elevate your advantage in proteomics—revealing more of the proteome for you, so you can unveil new discoveries for the world.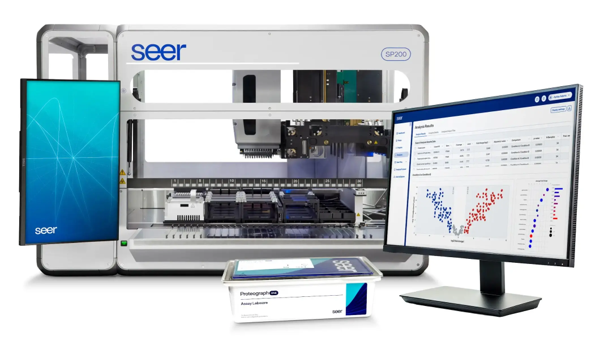
Workflow
- Sample Prep with SEER Proteograph
- LC/MS/MS
- Data Workup
Targeted differential expression proteomics characterizes the changes in the proteome as a function of biological challenges such as genotype, disease state, drug treatment and cell cycle. As these experiments are targeted to specific proteins, they are hypothesis-driven assays, including biomarker verification.
- Full support - experimental design, sample preparation and analysis, initial data analysis
- State-of-the-art LC/MS/MS based technology using Multiple Reaction Monitoring (MRM) or Parallel Reaction Monitoring (PRM)
- Stable isotope labeled peptide standards are used to provide "absolute" quantitation
- High throughput, high sensitivity and high reproducibility
- Can be multiplexed for hundreds of peptides
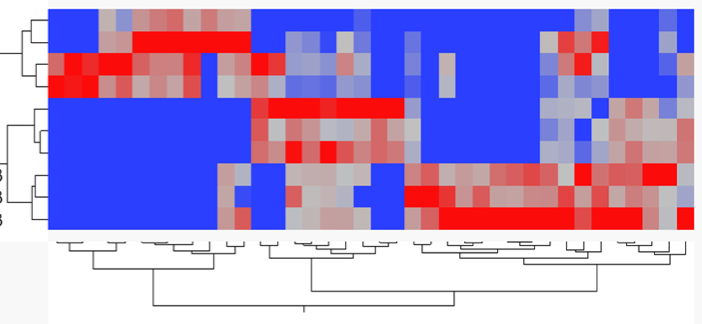
Tumor Associated Antigen Applied to Drug Resistance Model of HER2+ Breast Cancer Cell Lines
Principal Component Analysis
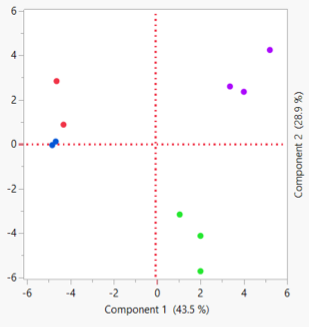
Expression results Z-score normalized with 2D Agglomerative Cluster Analysis
Workflow
- Sample Preparation
- LC/MS/MS
- Data Workup
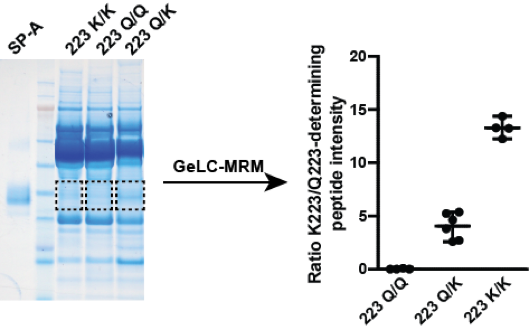
The expression of non-synonymous variants can be difficult or impossible to validate using existing immunoassays. Targeted proteomics can specifically and precisely measure single amino acid changes. Assays are adaptable to most biological matrices, highly multiplexible and require small protein quantities.
- Full support - experimental design, sample preparation and analysis, initial data analysis
- State-of-the-art LC/MS/MS based technology using Multiple Reaction Monitoring
- Assays use internal standards for each peptide of interest
- High throughput, high sensitivity, high reproducibility and rigorous quality control
- Can be multiplexed for hundreds of peptides
Targeted Quantitation of Expressed Variants of Pulmonary Surfactant Protein A
Quantitation of K223 variant of SP-A with internal standard
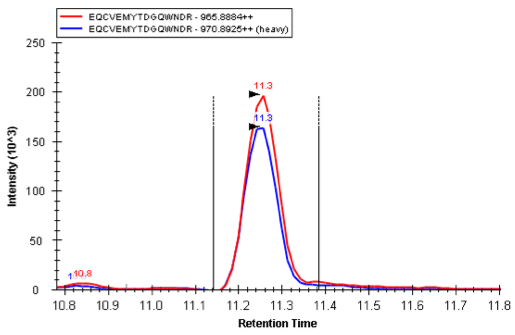
Identification of individuals with homozygous or heterozygous expression of SP-A variants
Workflow
- Sample Prep
- LC/MS/MS
- Data Workup
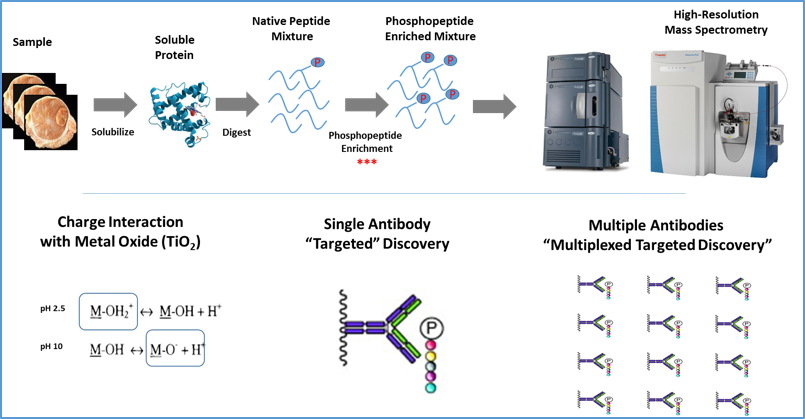
Enrichment of sub-proteomics based on their Post-Translational Modifications (PTMs) provides key information on the functional status of the proteome. PTM-specific enrichments prior to quantitative profiling provide unique information and deep proteome mining. Enrichments are available for phosphorylation (pST, pY, motif-specific antibodies), acetylation (Ac-K), ubiquitination (GG-K), and methylation (R & K).
- Full Support - experimental design, sample preparation and data collection, initial data analysis
- State-of-the-art LC/MS/MS based technology using rigorous quality control metrics
- Enrichments made using physiochemical methods and/or motif-specific antibiodies
- Phos enrichments include pST, pY, and motif-specific phosphorylation (Akt, MAPK, etc.)
- Quantitative and qualitative coverage for >30,000 phosphopeptides has become routine
Analytical workflows for quantitative profiling of post-translationally modified proteomes using phosphorylation as an exemplar
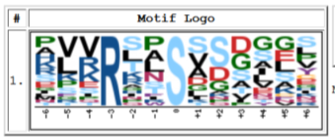
Representative motif analysis of phosphorylation from a quantitative phosphoproteomic study
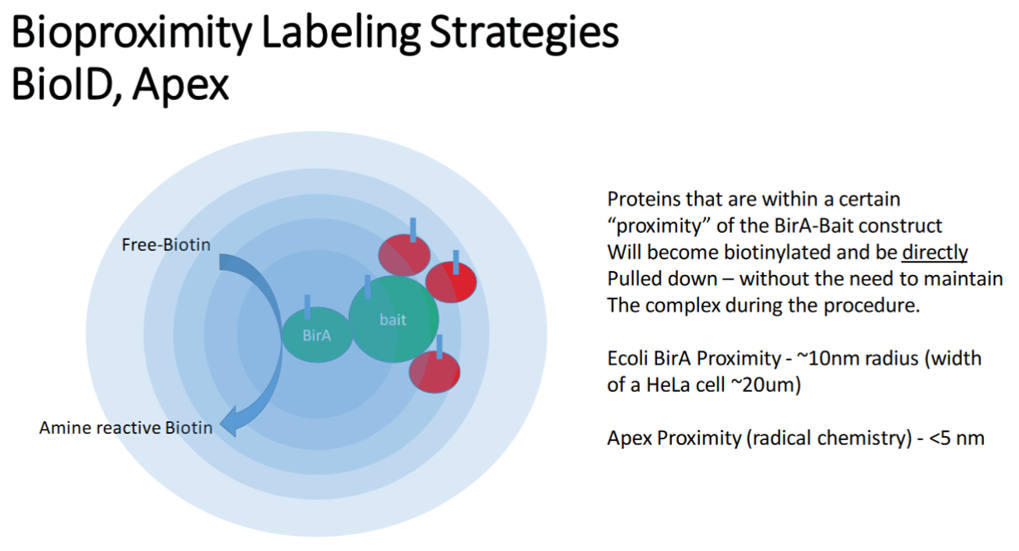
Characterization of protein interactions with specific proteins of interest is supported from a number of upstream enrichment strategies including; Bioproximity labeling (BioID, Apex) and classical affinity-purification. The DPMCF has extensive experience in using high resolution mass spectrometry to quantitativly characterize these interactomes including preferred enrichments, data acquisition strategies and data analysis workflows.
- Full Support - experimental design, sample preparation and analysis, initial data analysis
- State-of-the-art LC/MS/MS based technology using rigorous quality control metrics
- Enrichments made using streptavadin (BioID) and/or target-specific antibodies
- Quantitative and qualitative coverage for both high affinity and low affinity interactors has become routine
Metabolomics
Quantitative Bile Acids Analysis
The Duke Proteomics and Metabolomics Shared Resource utilizes the Biocrates AbsoluteIDQ Bile Acids Kit to analyze endogenous bile acids, including 19 conjugated and unconjugated, primary and secondary bile acids. Bile acids have many biological functions, including biomarkers for liver function, signaling molecules with hormone-like functions and biomarkers for gut microbiota. The Biocrates Bile Acids Kit utilizes Acquity UPLC coupled to a Xevo TQ-S triple quadrupole mass spectrometry by Waters Corporation to perform quantitative multiplexed analysis of up to 16 human or 19 murine bile acids in plasma samples. Bile Acids profiled with the kit are shown in Table 1. Serum samples can also be analyzed with the bile acid kit; other sample matrices may be compatible but will need to be considered on a case-by-case basis. In a typical plasma or serum sample from a healthy donor, 10 bile acids are present in amounts greater than the limit of quantitation. Composite variables and indices calculated using the individual bile acid quantity measures have also been shown to describe certain clinical conditions. Pricing is performed on a per sample basis, plus the cost of consumables from Biocrates. For more details visit our pricing page.
Technical Information
Much like the Biocrates Q500 kit, a 96 well plate is used for analysis, which includes calibration standards and isotopically labeled internal standards along with quality control samples and blanks. Up to 80 experimental samples can be analyzed on one plate. Only 10 uL of sample is required in each well per analysis. A typical chromatogram for separation of bile acid standards from the standard curve is shown in the figure below.
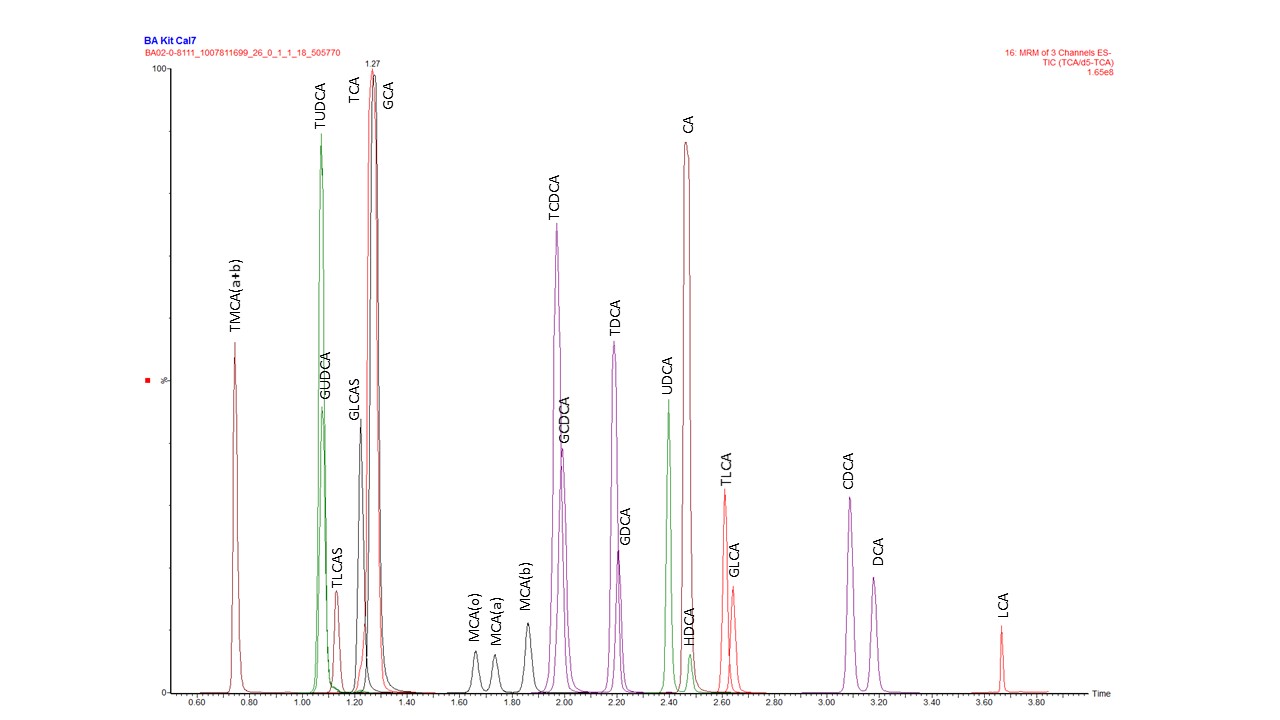
Negative electrospray ionization source conditions allow for the bile acids to be more readily detected by MS/MS instrumentation. The typical concentration range detected with the Biocrates Bile Acids Kit is 0.05 – 10 uM, although this range can vary depending on the specific bile acid. Quantitation of bile acids is performed using the calibration curve generated as part of the standard analysis.
The table below details abbreviations used in the chromatogram shown above along with the full bile acid name and type. Primary bile acids originate from direct synthesis by liver cells. Before secretion, primary bile acids are conjugated with either glycine or taurine within the liver to form the conjugated bile acids, commonly known as bile salts. In healthy humans, bile, overall, is about 70% glyco-conjugated and 20% tauro-conjugated. Once the bile salts are secreted into the intestine, gut bacteria partially dehydroxylates and removes the glycine and taurine conjugation to produce secondary bile acids.
| Abbreviation | Bile Acid Name | Bile Acid Type |
|---|---|---|
| CA | Cholic acid | Primary |
| CDCA | Chenodeoxycholic acd | Primary |
| DCA | Deoxycholic acid | Secondary |
| GCA | Glycoholic acid | Glyco-conjugated |
| GCDCA | Glycochenodeoycholic acid | Glyco-conjugated |
| GDCA | Glycodeoxycholic acid | Glyco-conjugated |
| GLCA | Glycolithocholic acid | Glyco-conjugated |
| GLCAS | Glycolitocholic acid sulfate | Glyco-conjugated |
| GUDCA | Glycoursodeoxycholic acid | Glyco-conjugated |
| HDCA | Hyodeoxycholic acid | Secondary |
| LCA | Lithocholic acid | Secondary |
| MCA(a) | α-Muricholic acid | Primary (mouse) |
| MCA(b) | Muricholic acid, beta | Primary (mouse) |
| MCA(o) | Muricholic acid, omega | Primary (mouse) |
| TCA | Taurocholic acid | Tauro-conjugated |
| TCDCA | Taurochenodeoxycholic acid | Tauro-conjugated |
| TDCA | Taurodeoxycholic acid | Tauro-conjugated |
| TLCA | Taurolithocholic acid | Tauro-conjugated |
| TLCAS | Taurolithocolic acid sulfate | Tauro-conjugated |
| TMCA (a+b) | Tauromuricholic acid (alpha + beta) | Tauro-conjugated (mouse) |
| TUDCA | Tauroursodeoxycholic acid | Tauro-conjugated |
| UDCA | Urodeoxycholic acid | Secondary |
The figure below summarizes the biochemical pathways of bile acid production and reveals relationships between different classes of bile acids. Bile acid abbreviations correspond to those detailed in the above table. All bile acids are produced from cholesterol and two key intermediates, 7-alpha-hydroxycholesterol and 4-cholesten-7a-ol-3-one, which are the rate determining steps in the pathway.
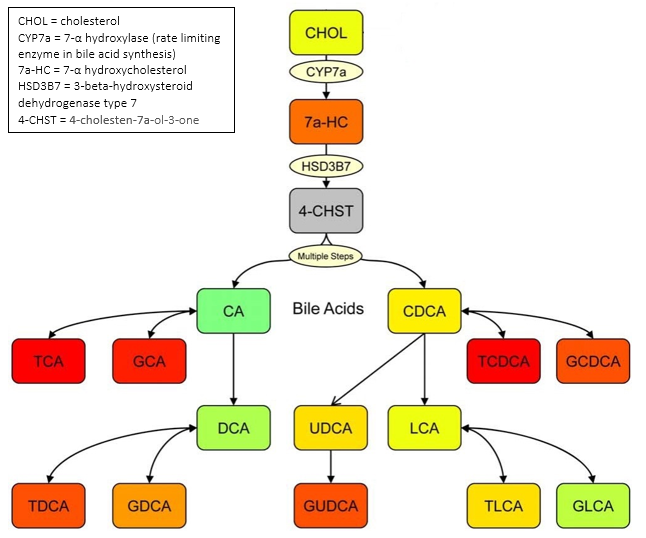
Figure used with permission of the author. doi: 10.1371/journal.pone.0025482
We perform multiplexed quantitative analysis of amino acids, biogenic amines, glycerophospholipids, sphingolipids, and acylcarnitines with the Biocrates MxP Q500 kit, which allows for a wide range of biological and therapeutic studies with samples originating from cell cultures to animal models and human biological fluids although it has been developed specifically for plasma samples. Pricing is performed on a per sample basis, plus the cost of consumables from Biocrates. For more details, visit our pricing page.
The Biocrates MxP Q500 kit uses a 96-well plate layout as shown below, which can accommodate up to 80 study samples in addition to necessary blanks and standards. Each well requires 10 uL of sample matrix for analysis. More specific information on the exact metabolites which can be detected by this kit can be found on the Biocrates Q500 list of metabolites.
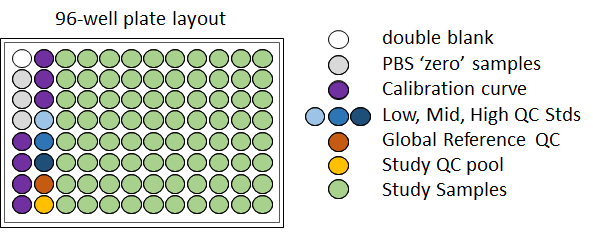
Although the Q500 kit can detect up to 633 metabolites, actual coverage within any particular matrix varies widely depending on the metabolite abundance in those particular matrices. Additionally, only some of the potentially identifiable metabolites will be relevant to your experiment. We have performed experiments to further define biochemical coverage across a variety of matrices to assist in aligning this platform with your study of interest.
With this kit, analyzing most amino acids and biogenic amines is facilitated by derivatization with phenylisothiocyanate. The derivatization reaction yields phenylthiocarbamyl derivatives, which allows for improved chromatographic separation of the analytes of interest. Glycerophospholipids, sphingolipids and acylcarnitines undergo the same sample preparation steps but remain underivatized and subsequently analyzed directly by flow-injection analysis tandem mass spectrometry (FIA-MS/MS). Metabolite quantitation is achieved with the use of stable-isotope labeled internal standards pre-pipetted onto the kit plate. Most biogenic amines and amino acids are fully quantified in each experiment with a seven-point calibration curve. All other analytes are semi-quantitated with a single point standard and concentration linearity is assumed. The concentration range detected by a Biocrates Q500 kit varies with the analyte of interest and the sample matrix.
The figures above illustrate the differences between FIA-MS/MS and LC-MS/MS of the targeted analytes. Figure A shows a smaller time window compared to figure B, and there is no chromatographic separation in flow-injection analysis. The mass spectrometric analysis is performed on a Sciex 6500+ TQ tandem mass spectrometer and an Acquity UPLC is used for the liquid chromatography separation. An example of a report provided by the Duke Proteomics and Metabolomics Shared Resource as a final product of our analysis is available for download below. If you have further questions about metabolite identification and quantification in our laboratory, please contact us.
We have developed a platform to quantify a number of known hydroxycholesterol isomers. Hydroxycholesterols are metabolites of cholesterol that exist at approximately three orders of magnitude lower concentration than the precursor, and exhibit signaling properties as diverse as immune response regulation (25-hydroxycholesterol) and estrogen receptor signaling (27-hydroxycholesterol).
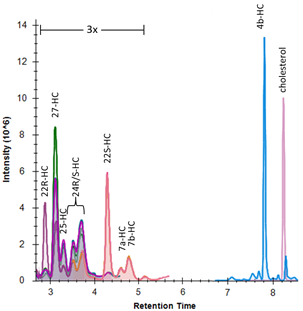
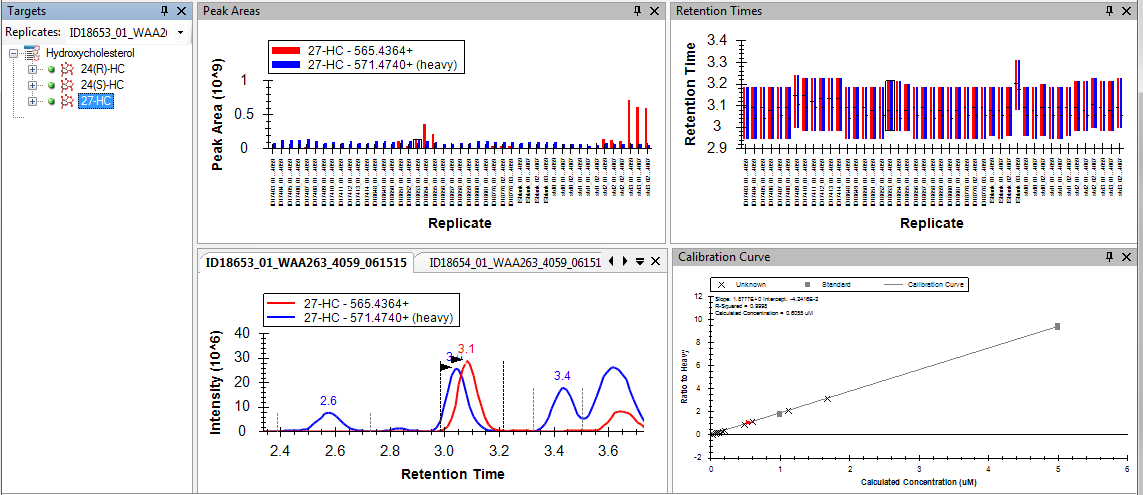
The method uses base hydrolysis to measure the total of free and esterified hydroxycholesterol of each isoform and has been specifically designed to perform chromatographic resolution of individual positional isomers, as demonstrated in the panel above. The quantification range used for plasma samples is 0.1 uM to 10 uM. Analysis is performed using Acquity UPLC and a Xevo TQ-S tandem mass spectrometer. The quantitative method utilizes LipidMaps stable-isotope internal standards for 22R, 22S, 24R/S, 27, 4b, 7a/b-hydroxycholesterols and cholesterol, and quantification is performed using quantitative standards in a bovine serum albumin matrix. The Skyline quantitative metabolomics package performs data analysis (example shown below).
The hydroxycholesterol panel has been specifically designed to measure biofluids, but different sample matrices can likely be accommodated. If you have questions about hydroxycholesterol quantification in our laboratory, please contact Laura Dubois.
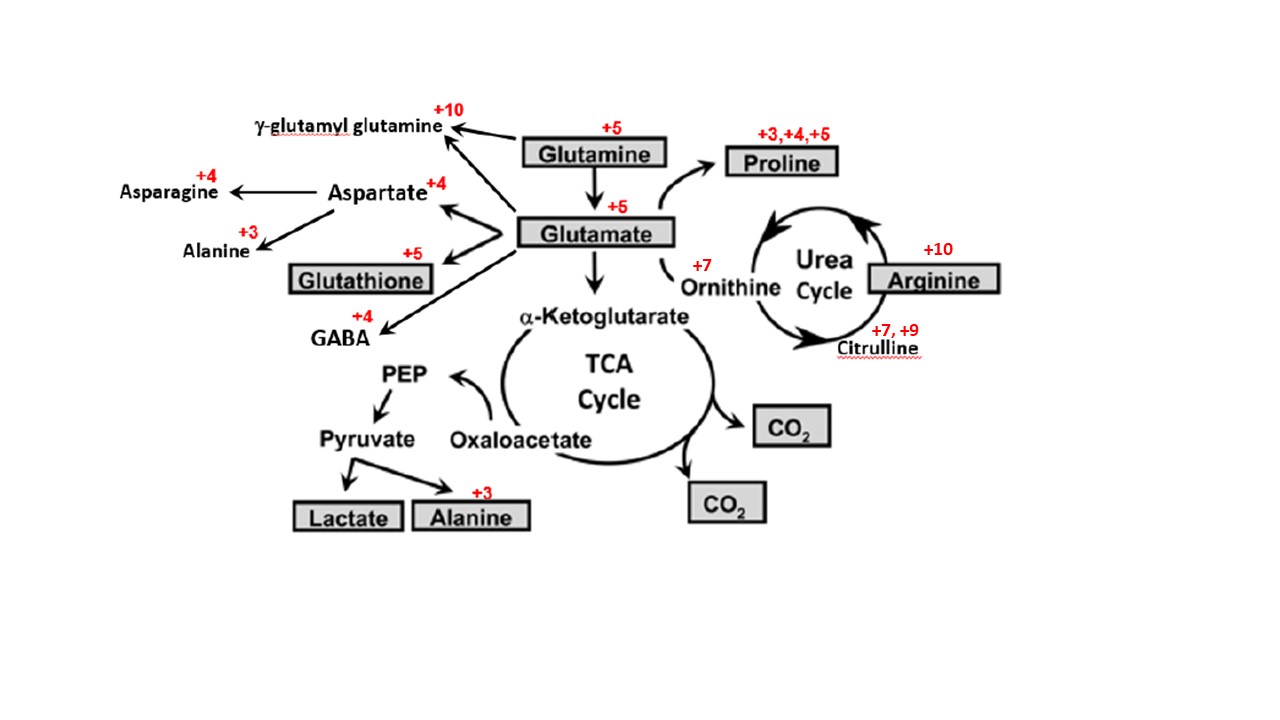
We study metabolic pathways through the relative quantitation of isotope incorporation after cell culture or tissue exposure to isotopically labeled compounds. In general, isotope incorporation experiments allow for the resolution of differences between many interconnected metabolic pathways1. Metabolic isotope incorporation has primarily been performed on glycolysis and the TCA cycle; however, it is also possible to study the pentose phosphate pathway, acetyl-CoA, fatty acids, purines and pyrimidines along with redox metabolomics with isotope incorporation. These metabolic pathways are crucial for cardiovascular function2, development of Alzheimer’s disease, and inborn errors of metabolism3.
We use a specialized capillary electrophoresis system called a ZipChipTM from 908 Devices coupled to a high resolution orbitrap MS/MS to analyze isotope incorporation metabolomics samples. The ZipChip platform optimizes separation of amino acids within a short method analysis time, and when combined with a high resolution orbitrap, co-migrating pairs can be identified and distinguished from interference as well based on differences in m/z. The figure below shows some of the details of isotope incorporation analysis with a ZipChip.
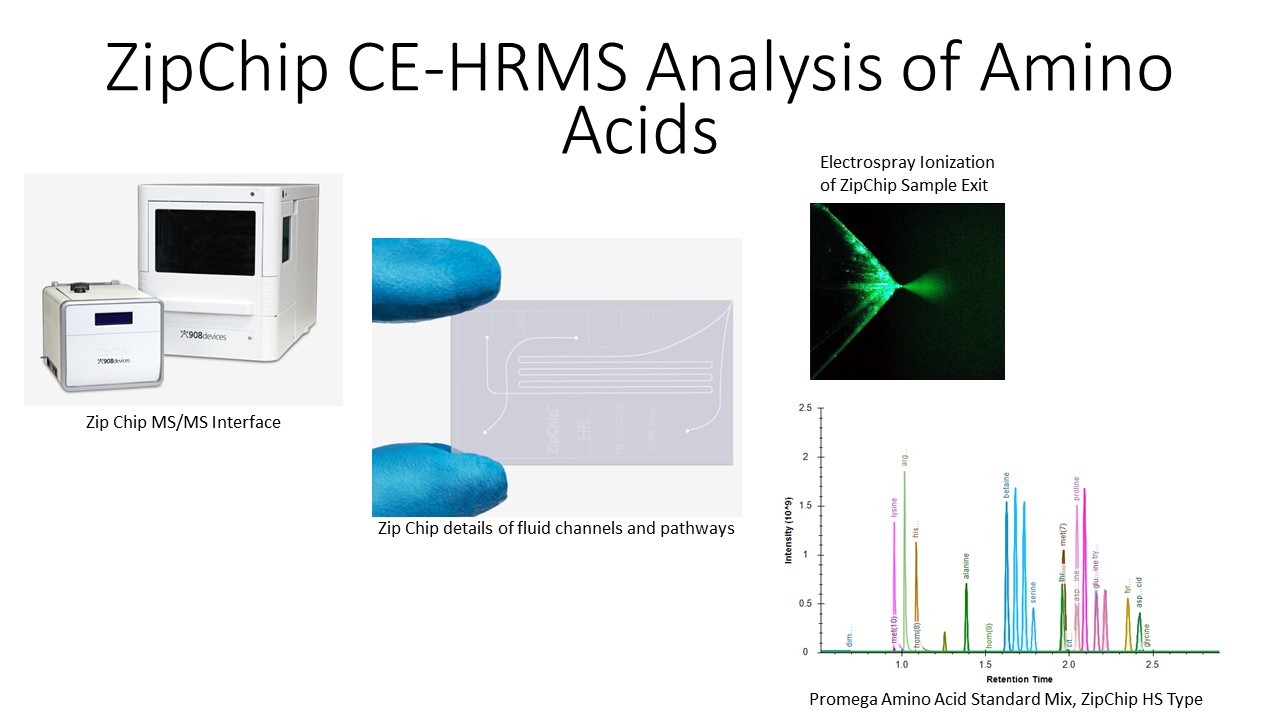
The sample types accepted for isotope incorporation analysis include cell cultures, tissues, plasma, and dried blood spots on paper. The figure below shows a partial summary of glutamine metabolism4. The molecules measured in the assay include the compounds in the figure below with red annotations, which denote the number of carbons measured as incorporated into each compound. An example of the data generated from this platform details the quantitative isotopic incorporation of arginine +10 into the plasma of pediatric malaria patients5.
If you would like to submit samples for isotope incorporation metabolomic analysis, please contact us to discuss the details of your experiment.
*Note: Samples cannot be accepted without prior consultation.
References
- Integration of Flux Measurements and Pharmacological Controls to Optimize Stable Isotope-Resolved Metabolomics Workflows and Interpretation. Lorkiewicz, P. K., Gibb, A. A., Rood, B. R., et al. Nature Sci. Reports 9, 13705 (2019). doi:10.1038/s41598-019-50183-3.
- Metabolomics and Isotope Tracing. Jang C, Chen L, Rabinowitz JD. Cell 173, 822 (2018). doi:10.1016/j.cell.2018.03.055
- Cardiovascular Metabolomics. McGarrah, R. W., Crown, S. B., Zhang, G.-F., et al. Circulation Res. 122, 9 (2018). doi:10.1161/CIRCRESAHA.117.311002.
- Metabolic Fate and Function of Dietary Glutamate in the Gut. Burrin, D. G., and Stoll, B. The American Journal of Clinical Nutrition, 90, 3 (2009). doi:10.3945/ajcn.2009.27462Y.
- Kinetic and Cross-Sectional Studies on the Genesis of Hypoargininemia in Severe Pediatric Plasmodium falciparum Malaria. Rubach, M. P., Zhang, H., Florence, S. M., et al. Infection and Immunity 87, 4, (2019). doi.org/10.1128/IAI.00655-18.
Sphingosine-1-phosphate (S1P, HMDB00277) is a biologically significant lysophospholipid (specifically a sphingolipid), with important roles in intracellular inflammation, cancer, and Alzheimer’s disease1. S1P is involved in calcium signaling pathway, cyclooxygenase-2 (COX-2) inductions, and eicosanoid production2. We have developed a quantitative LC-MS/MS assay, the S1P Panel, that quantifies four metabolites in sphingolipid metabolism (KEGG HSA00600): sphingosine-1-phosphate (green trace), sphingosine (pink trace), sphinganine (blue trace), and d18:2-S1P (yellow). A chromatogram of the analysis of a tissue sample is shown below; the total analysis time is five minutes per sample and carryover between samples was validated at <0.1%. While the utility and biological function of S1P, sphingosine, and sphinganine are well documented, the assay also quantifies d18:2-S1P, which has been shown as a reliable marker to identify samples which were improperly collected or stored at room temperature for extended periods of time3.
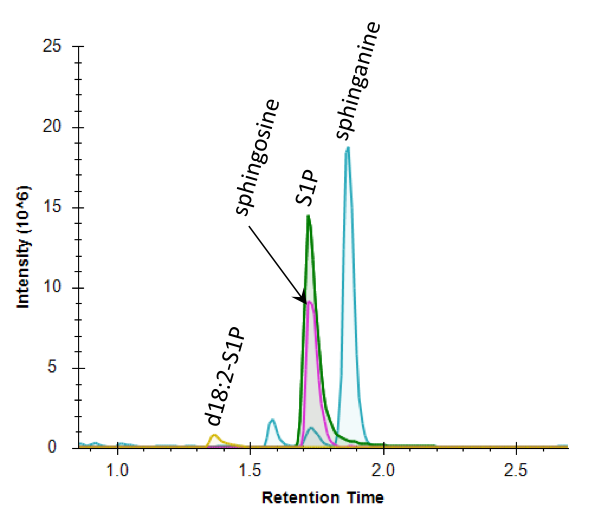
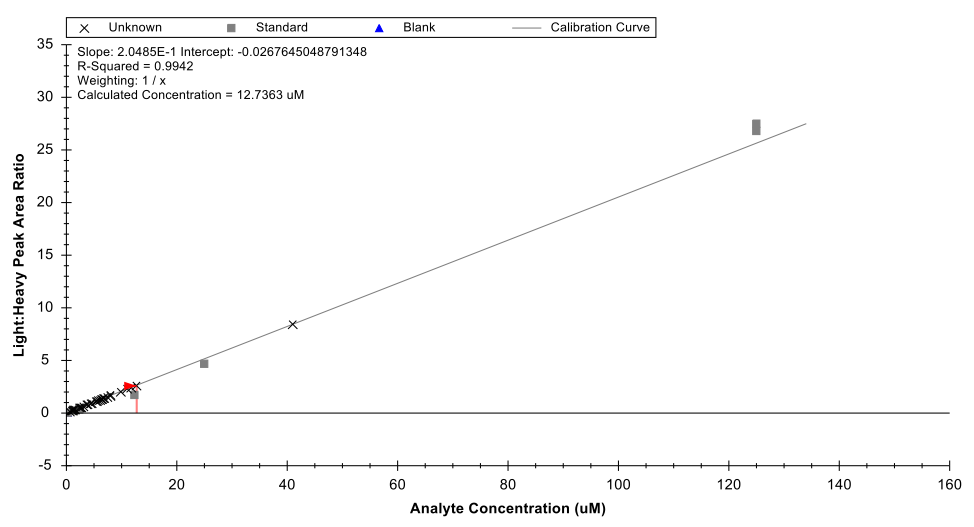
The panel has been validated for quantifying these compounds from variety of matrices including plasma, serum, and various tissues. The assay only requires 10 uL of serum or plasma and can be performed on <50 mg of tissue. The quantification range used is 0.2 uM to 125 uM. Analysis is performed using LC-MS/MS operating in multiple reaction monitoring mode and Skyline is used to quantify the metabolites based on external calibration curves (standards from Avanti Polar Lipids) with the use of d7-S1P as an internal standard. An example of a calibration curve shown below for sphingosine-1-phosphate.
References:
- Maceyka M, Harikumar KB, Milstien S, Spiegel S. SPHINGOSINE-1-PHOSPHATE SIGNALING AND ITS ROLE IN DISEASE. Trends in Cell Biology. 2012;22(1):50-60. doi:10.1016/j.tcb.2011.09.003.
- National Center for Biotechnology Information. PubChem Compound Database; CID=5283560, https://pubchem.ncbi.nlm.nih.gov/compound/5283560
- Liu X, Hoene M, Yin P, Fritsche L, Plomgaard P, Hansen J, Nakas C, Niess A, Hudemann J, Haap M, Mendy M, Weigert C, Wang X, Fritsche A, Peter A, Häring, H-U, Xu, G, and Lehmann R. QUALITY CONTROL OF SERUM AND PLASMA BY QUANTIFICATION OF (4E,14Z)-SPHINGADIENINE-C18-1-PHOSPHATE UNCOVERS COMMON PREANALYTICAL ERRORS DURING HANDLING OF WHOLE BLOOD. Clinical Chemistry. 2018;64:5. Doi:10.1373/clinchem.2017.277905.
Short-chain fatty acids (SCFAs) are the major class of metabolites produced in the large bowel by the anaerobic gut microbiome1, and they play an essential, yet incompletely understood role in a wide variety of human diseases, including autoimmune diabetes2, non-alcoholic liver disease3, cirrhosis4, neurodevelopmental disorders5-7, atherosclerosis8, vaccine response9, graft vs. host disease10, obesity11, cardiovascular disease12, and kidney disease13.
We utilize a UPLC-MS/MS method14-15 to analyze short chain fatty acids (SCFAs), including 12 acids from C-2 to C-8 (Table 1). The SCFA method utilizes an Acquity UPLC coupled to a Xevo TQ-S triple quadrupole mass spectrometry by Waters Corporation to perform quantitative multiplexed analysis of up to 12 SCFAs in fecal samples. Fecal, serum and plasma samples can be analyzed with this SCFA method; other sample matrices may be compatible but will need to be considered on a case-by-case basis. In a typical fecal or plasma sample from a healthy donor, 6-10 SCFAs are present in amounts greater than the lower limit of quantitation. Pricing is performed on a per sample basis, plus the cost of running calibration curves (typically equivalent in cost to 10 samples). Note that Solid samples will require an additional sample preparation step, typically bead blasting.
Pricing
Technical Information:
A 96 well plate is used for analysis, which includes calibration standards and isotopically labeled internal standards, along with quality control samples and blanks. Up to 80 experimental samples can be analyzed on one plate. Only 50 milligrams of fecal material is required per sample analysis. A typical chromatogram for separation of SCFAs from a fecal sample is shown in Figure 1A, and the reproducibility of the chromatography for the analysis of > 100 samples is illustrated in Figure 1B.
Negative electrospray ionization allows for the SCFAs to be readily and specifically detected by MS/MS instrumentation. The typical concentration range detected with the method is 0.1 – 200 uM, although this range can vary depending on the specific acid to be analyzed. Quantitation of SCFAs is performed using the calibration curve generated as part of the standard analysis.
Table 1 – List of Targeted SCFAs. The table above provides abbreviations used in the chromatogram shown in Figure 1, along with the full acid name and carbon number
| SCFA Name | Abbreviation | Carbon Number |
| Acetic acid | AA | C-2 |
| Propionic acid | PA | C-3 |
| i-Butyric acid | i-BA | C-4 |
| Butyric acid | BA | C-4 |
| 2-Me-Butyric acid | 2-Me-BA | C-5 |
| Isovaleric acid | i-VA | C-5 |
| Valeric Acid | VA | C-5 |
| 3-Me-Valeric acid | 3-Me-VA | C-6 |
| i-Caproic acid | i-CA | C-6 |
| Caproic acid | CA | C-6 |
| Heptanoic acid | HA | C-7 |
| Octanoic acid | OA | C-8 |
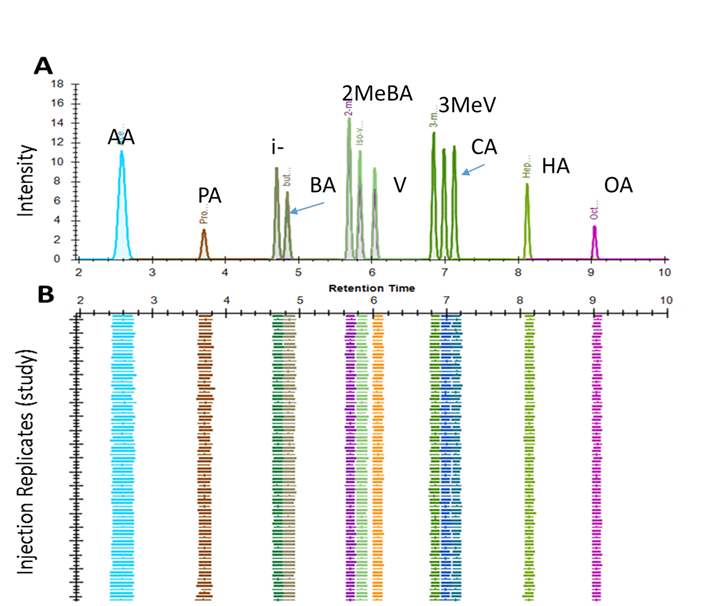
Figure 1. (A) Chromatogram of separation of short chain fatty acid NPH derivatives by LC-MS/MS and (B) the reproducibility in retention time observed over >100 injections.
Follow the recommendations carefully below to submit samples for Short Chain Fatty Acid (SCFA) analysis of fecal, cecal, or tissue samples. Contact Laura DuBois with questions.
- Samples need to be submitted in the tubes used for homogenization. (Precellys Lysing Kit, https://www.bertin-corp.com/life-sciences/30-precellys-lysing-kits-ck14.html#/capacity-2ml). In rare cases of very low sample size (i.e. < 10 mg) the 0.5 mL tubes are recommended.
- Tare the individual tubes, recording the weight. (All tubes vary somewhat in mass.)
- Add a mass of fecal material between 50-100 mg to each weighed tube. Seal the tube. Record the weight of the tube containing the sample, and when submitting the sample, include the weight of the sample – corrected for the tube weight.
IMPORTANT: Submitting samples with fecal weight above this range will result in an additional charge, as we will need to homogenize the sample, transfer, then re-homogenize. Sample weights below this range will adversely impact the Limit of Quantitation for those samples. Also, remember that error in sample weight is directly proportional to the error in the SCFA quantitative measurement. - Label each tube with the identifier to be used in the Sample Submission System.
Notes:
- Always use gloves when weighing the tubes including during the process of weighing them before addition of the sample.
- Record the weight of the tube and the tube plus sample in milligrams.
- Freeze the tubes at -80oC once they are prepared. If the tube are to be shipped, dry ice must be used to maintain the samples at low temperature.
- Be aware that the beads in the tubes can react to static electricity. Handle the tubes carefully to keep the beads from flying out of the tube.
References
- Short-chain fatty acids: ready for prime time? C.C. Roy, C.L. Kien, L. Bouthillier, E. Levy, Nutr. Clin. Pract. 2006, 21: 351–366
- Early-Life Nutritional Factors and Mucosal Immunity in the Development of Autoimmune Diabetes, Xiao L, Van't Land B, van de Worp WRPH, Stahl B, Folkerts G, Garssen J. Front Immunol. 2017, 8:1219
- Fructose: A Dietary Sugar in Crosstalk with Microbiota Contributing to the Development and Progression of Non-Alcoholic Liver Disease, Lambertz J, Weiskirchen S, Landert S, Weiskirchen R., Front Immunol. 2017, 8:1159
- Gut Microbiome-based Therapeutics in Liver Cirrhosis: Basic Consideration for the Next Step., Fukui H., J Clin Transl Hepatol. 2017, 5(3):249-260
- Cross Talk: The Microbiota and Neurodevelopmental Disorders., Kelly JR, Minuto C, Cryan JF, Clarke G, Dinan TG., Front Neurosci. 2017, 11:490
- Microbiome, inflammation, epigenetic alterations, and mental diseases, Alam R, Abdolmaleky HM, Zhou JR., Am J Med Genet B Neuropsychiatr Genet. 2017, 174(6):651-660
- Microbiome, probiotics and neurodegenerative diseases: deciphering the gut brain axis., Westfall S, Lomis N, Kahouli I, Dia SY, Singh SP, Prakash S., Cell Mol Life Sci. 2017
- Gut Microbiota and Atherosclerosis., Li DY, Tang WHW., Curr Atheroscler Rep. 2017, 19(10):39
- The potential of the microbiota to influence vaccine responses. Lynn DJ, Pulendran B., J Leukoc Biol. 2017
- Gut microbiota and acute graft-versus-host disease., Yoshioka K, Kakihana K, Doki N, Ohashi K., Pharmacol Res. 2017, 122:90-95
- Obesity and the gastrointestinal microbiota: a review of associations and mechanisms. Graham C, Mullen A, Whelan K. Nutrition Reviews, 73(6), 376–385;
- Gut Microbiota in Cardiovascular Health and Disease., Tang WH, Kitai T, Hazen SL., Circ Res. 2017, 120(7):1183-1196
- Intestinal Microbiota in Type 2 Diabetes and Chronic Kidney Disease., Sabatino A, Regolisti G, Cosola C, Gesualdo L, Fiaccadori E., Curr Diab Rep. 2017, 17(3):16
- An isotope-labeled chemical derivatization method for the quantitation of short-chain fatty acids in human feces by liquid chromatography-tandem mass spectrometry, Han J, Lin K, Sequeira C, Borchers CH, Anal Chim Acta. 2015, 854:86-94
- LC-MS/MS Method for Quantification of Short Chain Fatty Acids in Biological Samples, Christoffersen https://www.ucviden.dk/student-portal/files/39110634/Final_Report.pdf.